Fishbone Diagram: Manufacturing Problem Analysis
Fishbone Diagrams (or Ishikawa diagrams) are a powerful tool for identifying the root causes of manufacturing issues. They visually map out problems and their potential causes, helping teams systematically analyze and solve challenges like equipment breakdowns, quality defects, or inefficiencies. Here's what you need to know:
- What It Does: Helps pinpoint root causes of issues, reduce defects, and improve processes.
- How It Works: Organizes causes into categories like Man, Machine, Material, Method, Measurement, and Environment (6Ms).
- Why Use It: Encourages teamwork, aligns with Lean Six Sigma practices, and promotes data-backed solutions.
For example, a facility used this tool to address quality defects and implemented solutions like better training, automated maintenance, and updated procedures - resulting in fewer errors and improved efficiency. Whether you're tackling recurring problems or improving processes, Fishbone Diagrams are a practical, step-by-step method for manufacturers.
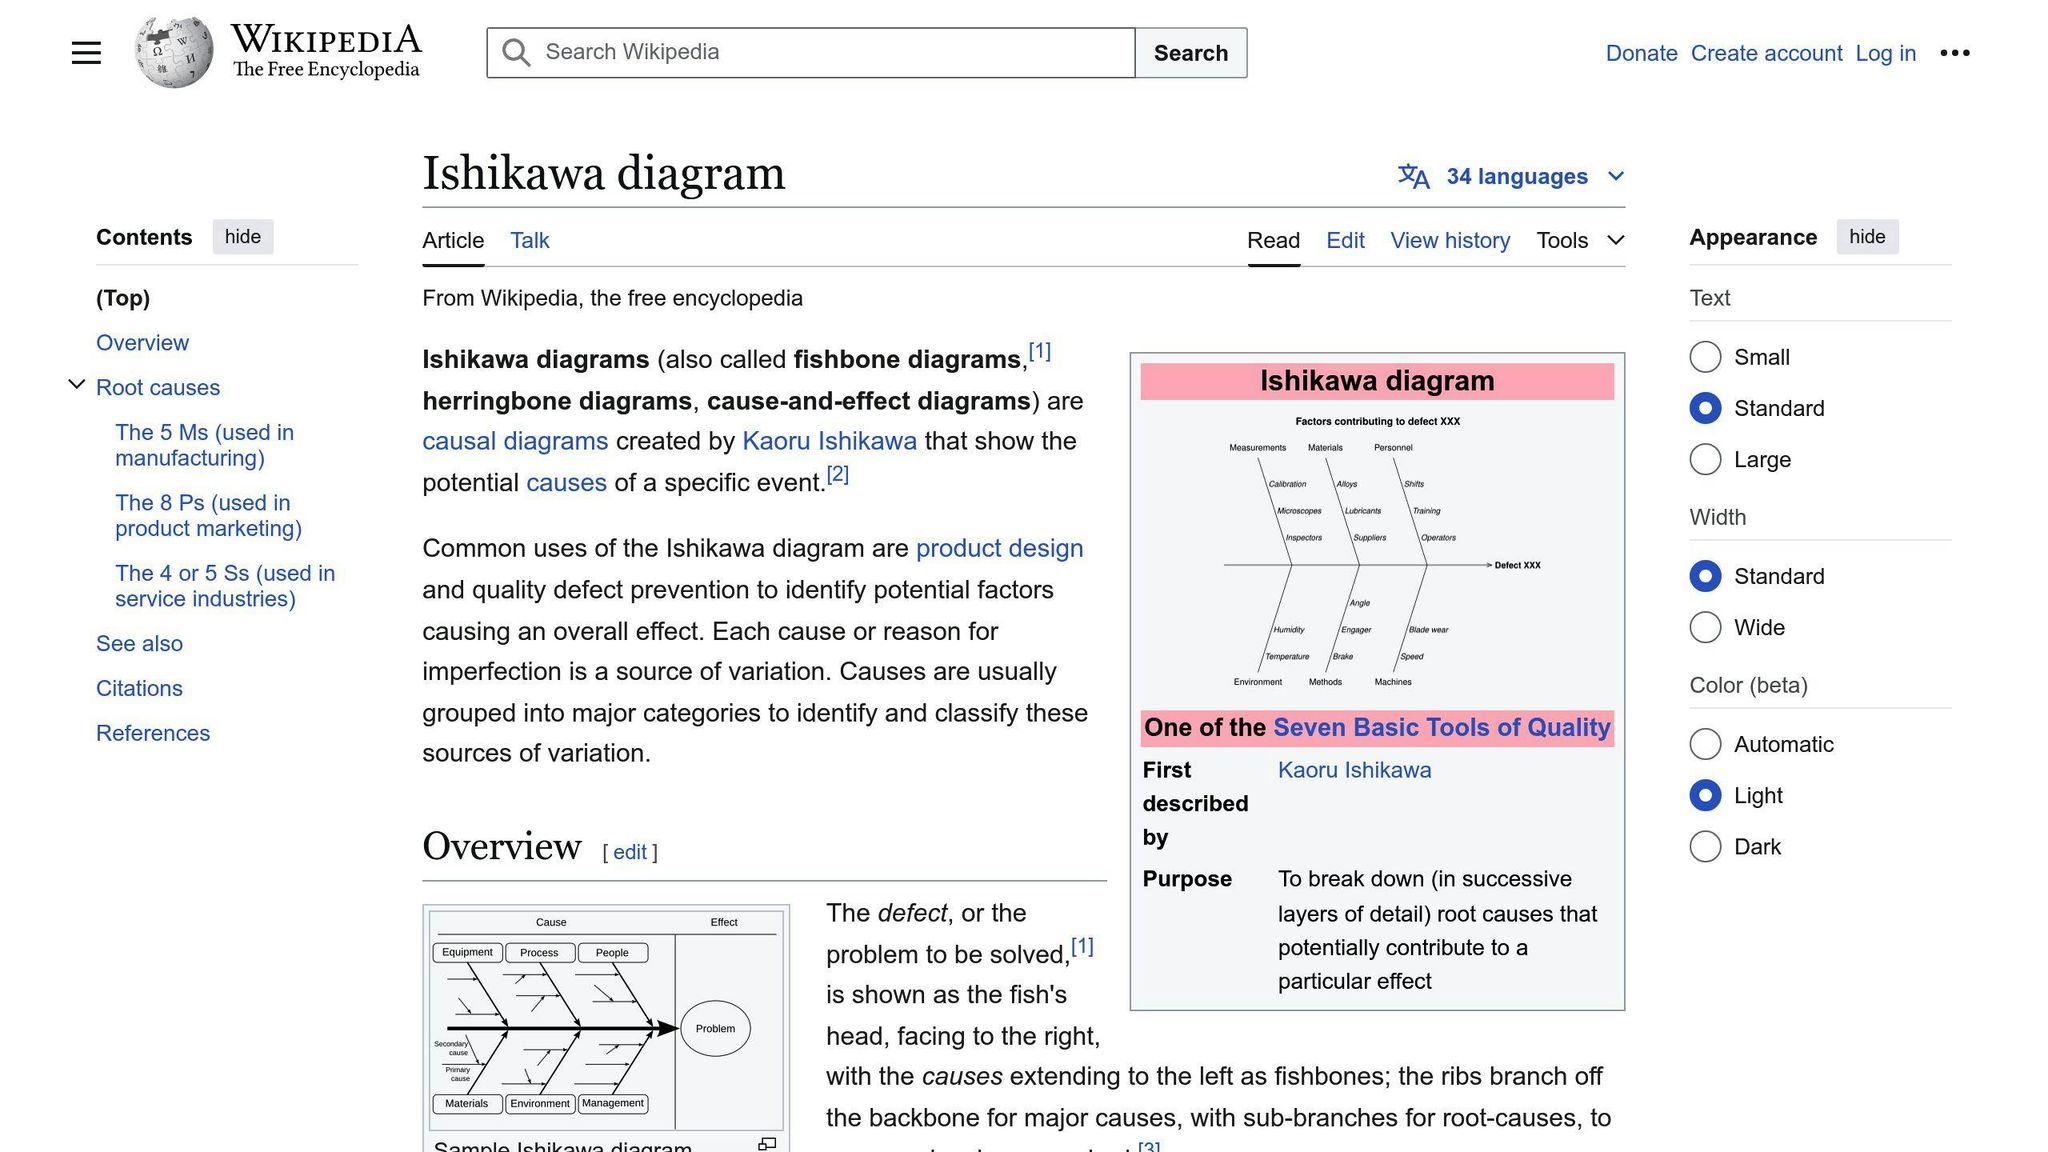
Structure of a Fishbone Diagram
Key Parts of a Fishbone Diagram
A Fishbone Diagram is made up of three main components used for analyzing manufacturing problems:
- The Head: This represents the main issue, such as defects or downtime. It needs to be clearly defined and measurable.
- The Spine: The central line that links the problem to its possible causes.
- The Bones: These branch out from the spine, showing different categories of causes. Primary causes connect directly to the spine, while secondary and tertiary causes branch further, creating a hierarchy to illustrate relationships.
Using the 5Ms and 6Ms Framework
The 5Ms and 6Ms framework is a structured way to group potential causes in manufacturing:
| Category | Examples in Manufacturing |
|---|---|
| Man | Training gaps, fatigue, skill levels |
| Machine | Equipment wear, calibration issues, tool lifespan |
| Method | Inconsistent procedures, setup errors |
| Material | Quality of raw materials, supplier standards |
| Measurement | Faulty inspection methods, inaccurate testing |
| Maintenance/Environment* | Preventive maintenance, temperature fluctuations |
*The sixth 'M' can refer to either Maintenance or Environment, depending on the situation.
This framework aligns with Lean Six Sigma practices, helping teams reduce waste and improve quality. To get the most out of this approach, focus on measurable factors, examine how categories interact, back causes with data, and prioritize the ones with the biggest impact.
Tools like EdrawMind and Canva provide templates that simplify creating Fishbone Diagrams, making collaboration and analysis easier. The visual layout of the diagram helps teams spot patterns and connections, making it a powerful tool for solving problems in manufacturing.
Applying Fishbone Diagrams to Manufacturing Problems
Finding Root Causes of Manufacturing Problems
Fishbone Diagrams are a practical tool for breaking down complex manufacturing issues into smaller, understandable parts. When tackling problems like equipment breakdowns or quality defects, these diagrams help teams see how different factors are connected and impact production.
For example, a manufacturing facility used this approach to address a quality control issue. Their analysis uncovered several related problems:
| Problem Area | Identified Causes | Solution Implemented |
|---|---|---|
| Training | Inconsistent operator knowledge | Standardized training programs |
| Maintenance | Missed preventive checks | Automated maintenance scheduling |
| Environment | Poor temperature control | Climate monitoring systems |
| Documentation | Outdated procedures | Digital SOP updates |
By organizing these findings, the facility was able to focus on specific areas and introduce targeted solutions. The result? Better product quality and fewer defects.
Fishbone Diagrams aren’t just about finding problems - they’re also a collaborative tool that helps teams work together to improve processes.
Improving Processes with Fishbone Diagrams
These diagrams are a great way to bring teams together and centralize insights when addressing quality or efficiency challenges. They visually lay out causes, making it easier to pinpoint solutions through structured analysis.
Here’s how teams typically use Fishbone Diagrams to improve processes: gather experts, collect relevant data, map out causes, and develop targeted solutions. Once implemented, the results are measured to ensure the changes are effective.
When internal resources fall short, external expertise can step in to strengthen efforts. For instance, manufacturers can use tools like the Machine Shop Directory to find precision machining or custom fabrication partners who can help execute solutions identified through Fishbone analysis.
How to Make a Fishbone Diagram - Root Cause Analysis
sbb-itb-b5aecec
Steps to Create a Fishbone Diagram
Building a Fishbone Diagram involves a clear, step-by-step process to pinpoint and address manufacturing issues. Here’s how to do it.
Step 1: Define the Problem Clearly
Start by identifying the specific problem you want to solve. For example, write something like "Increase in surface finish defects on CNC-machined components by 15% last quarter" on the right side of your diagram. This serves as the "fish head" and keeps your analysis focused.
Step 2: Brainstorm Potential Causes
Gather your team for a brainstorming session. Use the 6Ms framework (Man, Machine, Material, Method, Measurement, Environment) to organize possible causes into categories:
| Category | Examples of Causes |
|---|---|
| Man | Operator training, skill levels, shift patterns |
| Machine | Tool wear, equipment calibration, maintenance |
| Material | Raw material quality, storage conditions, supplier issues |
| Method | Setup processes, standard operating procedures |
| Measurement | Inspection methods, quality control systems |
| Environment | Humidity, temperature control, workplace layout |
Step 3: Map Causes and Plan Solutions
Sketch the diagram by drawing main "bones" for each category branching from the spine, and smaller "bones" for specific causes and sub-causes. You can use software tools to make this process more efficient and collaborative.
Evaluate the causes based on their impact and frequency. Prioritize those that:
- Are backed by solid data showing their role in the problem
- Can be addressed with the resources you have
- Offer measurable outcomes once resolved
For instance, if tool wear is identified as a key issue, you might implement a stricter tool replacement schedule or consult with machining specialists to improve processes.
Helpful Tools for Creating Fishbone Diagrams
To analyze manufacturing problems effectively using Fishbone Diagrams, having the right tools can make all the difference. Modern software options simplify the process, making teamwork smoother and more productive.
Software for Fishbone Diagrams
Here are some popular tools to help you create and manage Fishbone Diagrams:
| Software | Features | Ideal For |
|---|---|---|
| EdrawMind | Pre-designed templates, real-time collaboration, cloud storage | Large manufacturing teams |
| Canva | User-friendly drag-and-drop interface, easy sharing | Small to medium operations |
| XMind | Extensive customization, works across platforms | Technical analysis |
| Miro | Live teamwork features, integrations, unlimited canvas | Remote teams |
When selecting a tool, think about features like collaboration options, how well it works with your existing systems, customization capabilities, and export formats.
Using the Machine Shop Directory
The Machine Shop Directory is a valuable resource for manufacturers needing expert help. If your Fishbone Diagram points to technical challenges, this directory connects you with over 200 highly-rated machine shops specializing in precision machining and custom fabrication.
It can help manufacturers:
- Locate specialists for specific technical issues
- Compare providers based on their expertise
- Access custom machining and fabrication services
- Streamline process improvements effectively
This resource supports Lean Six Sigma practices, promoting structured problem-solving and ongoing improvement. By combining these tools and resources, teams can move from identifying problems to implementing solutions efficiently.
Conclusion
Summary of Key Points
Fishbone Diagrams are a practical tool for analyzing manufacturing problems, offering a clear structure for pinpointing and addressing complex issues. Their visual format and collaborative nature make them especially useful when multiple factors influence production quality.
Using Fishbone Diagrams effectively can lead to:
- Accurate identification of root causes
- Improved teamwork and information sharing
- Development of solutions based on data
- Long-term reduction in defects and inefficiencies
- Alignment with Lean manufacturing principles
Final Remarks
In a rapidly evolving manufacturing landscape, structured problem-solving tools are crucial for staying competitive. Success with Fishbone Diagrams relies on accurate data, engaged teams, and making the most of available resources.
By incorporating Fishbone Diagrams into Lean Six Sigma strategies, manufacturers can:
- Strengthen team problem-solving skills
- Achieve lasting improvements in quality
- Tackle complex technical issues with specialized expertise
- Leverage resources like the Machine Shop Directory to connect with precision machining and fabrication partners when needed
This methodical approach to problem-solving, paired with the right tools and expertise, helps manufacturers continuously improve and remain competitive in today’s challenging market.
FAQs
How to complete an Ishikawa diagram?
Follow these steps to create an Ishikawa diagram:
-
Define the Problem
Clearly outline the issue, including measurable impacts and a specific timeframe for analysis. -
Select Categories
Organize potential causes using the 6Ms framework (explained earlier). -
Identify Causes
Work with cross-functional teams to brainstorm causes for each category. Back up findings with data and observations. -
Sort and Analyze
Rank causes by their impact, validate them with evidence, and focus on those that can be addressed directly. -
Test and Verify
Investigate and confirm your findings, documenting them for future reference.
Using visual mapping tools can simplify the process and encourage collaboration. For technical challenges uncovered during this process, tools like the Machine Shop Directory can help connect you with skilled machining and fabrication experts.
Pro Tip: Include operators and floor staff in your analysis - they often provide insights that management might miss due to their hands-on experience.